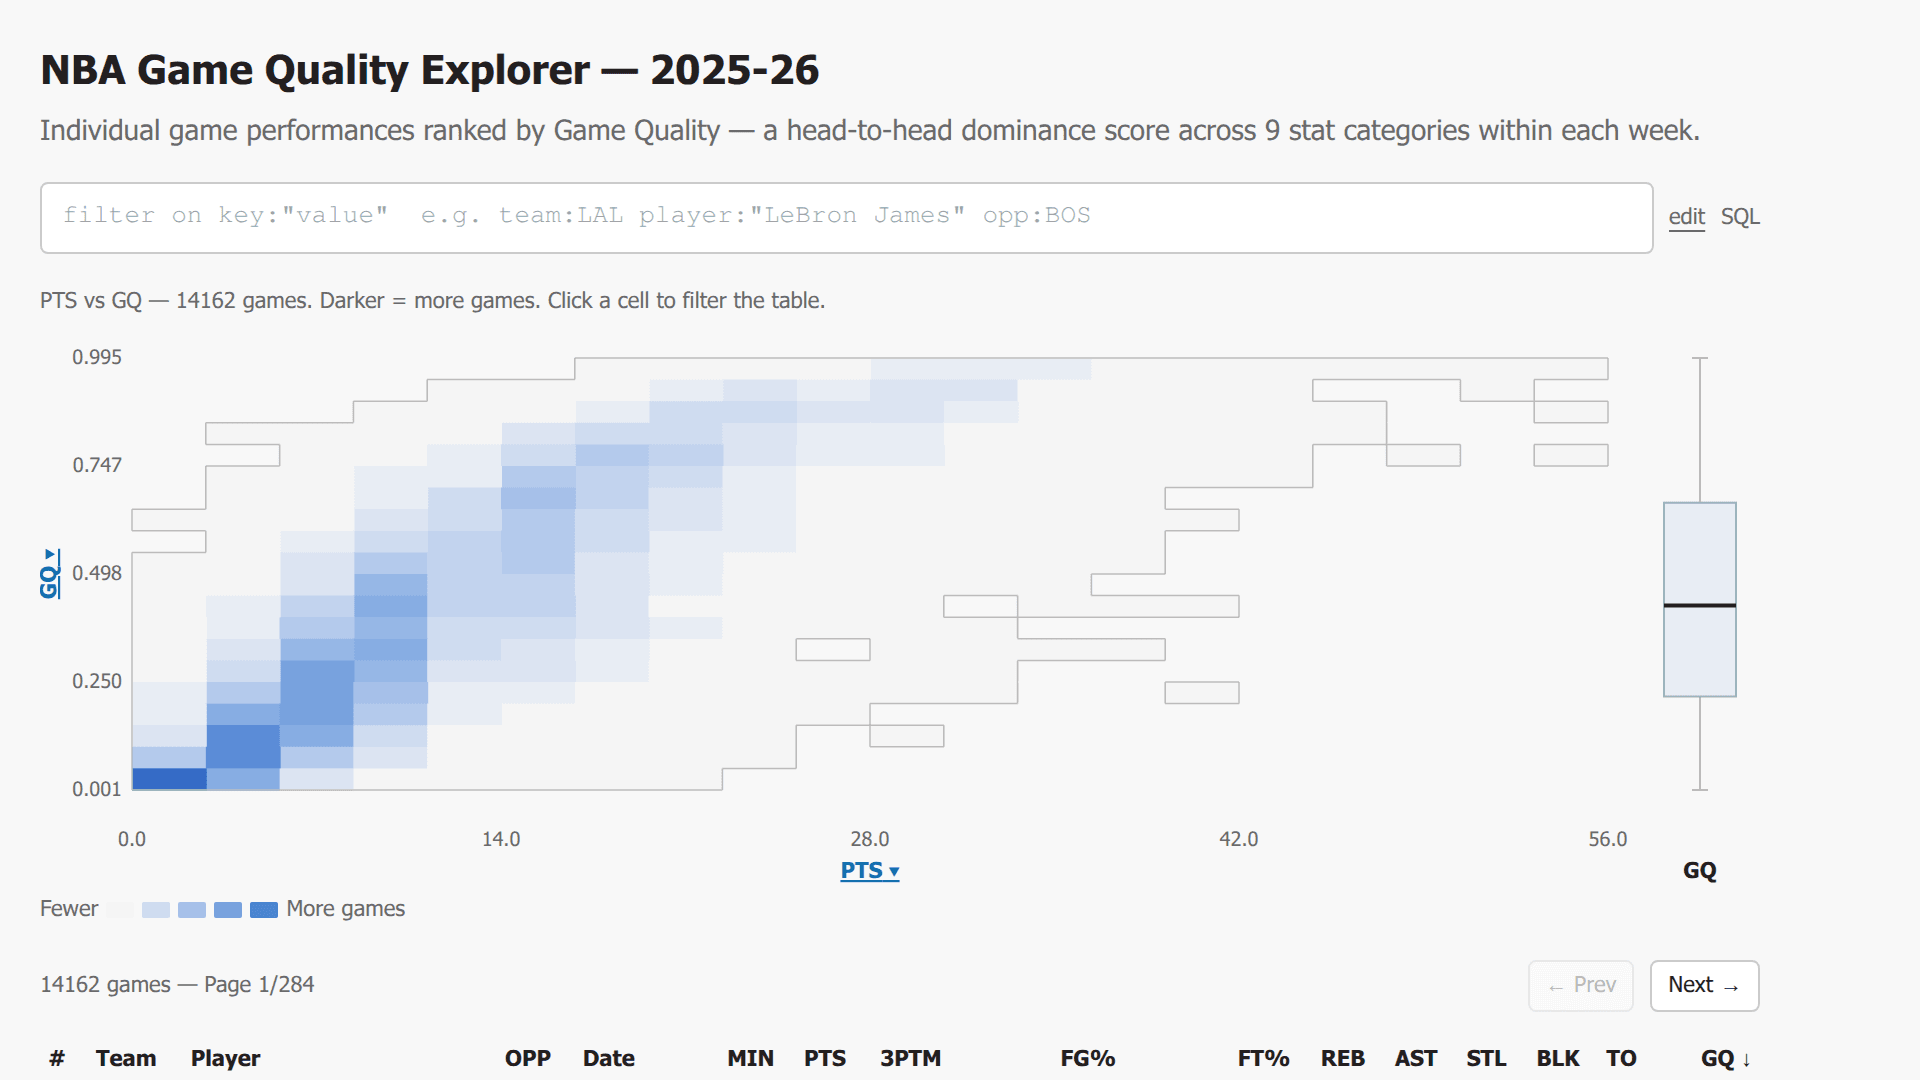
NBA Game Quality Explorer — 2025-26
Interactive NBA Game Quality explorer with Datadog-style key:value filter bar (Tab autocomplete, auto-close quotes, IN lists with bracket syntax, numeric comparisons, date part filters), edit/SQL toggle, 20x20 heatmap with contour edges and anchored axes, clickable axis label dropdowns, GQ box plot with player tick marks, orange dot overlay via player filter or dots:true directive, heatmap:true to apply filters to heatmap, sortable paginated table with click-to-filter rows.
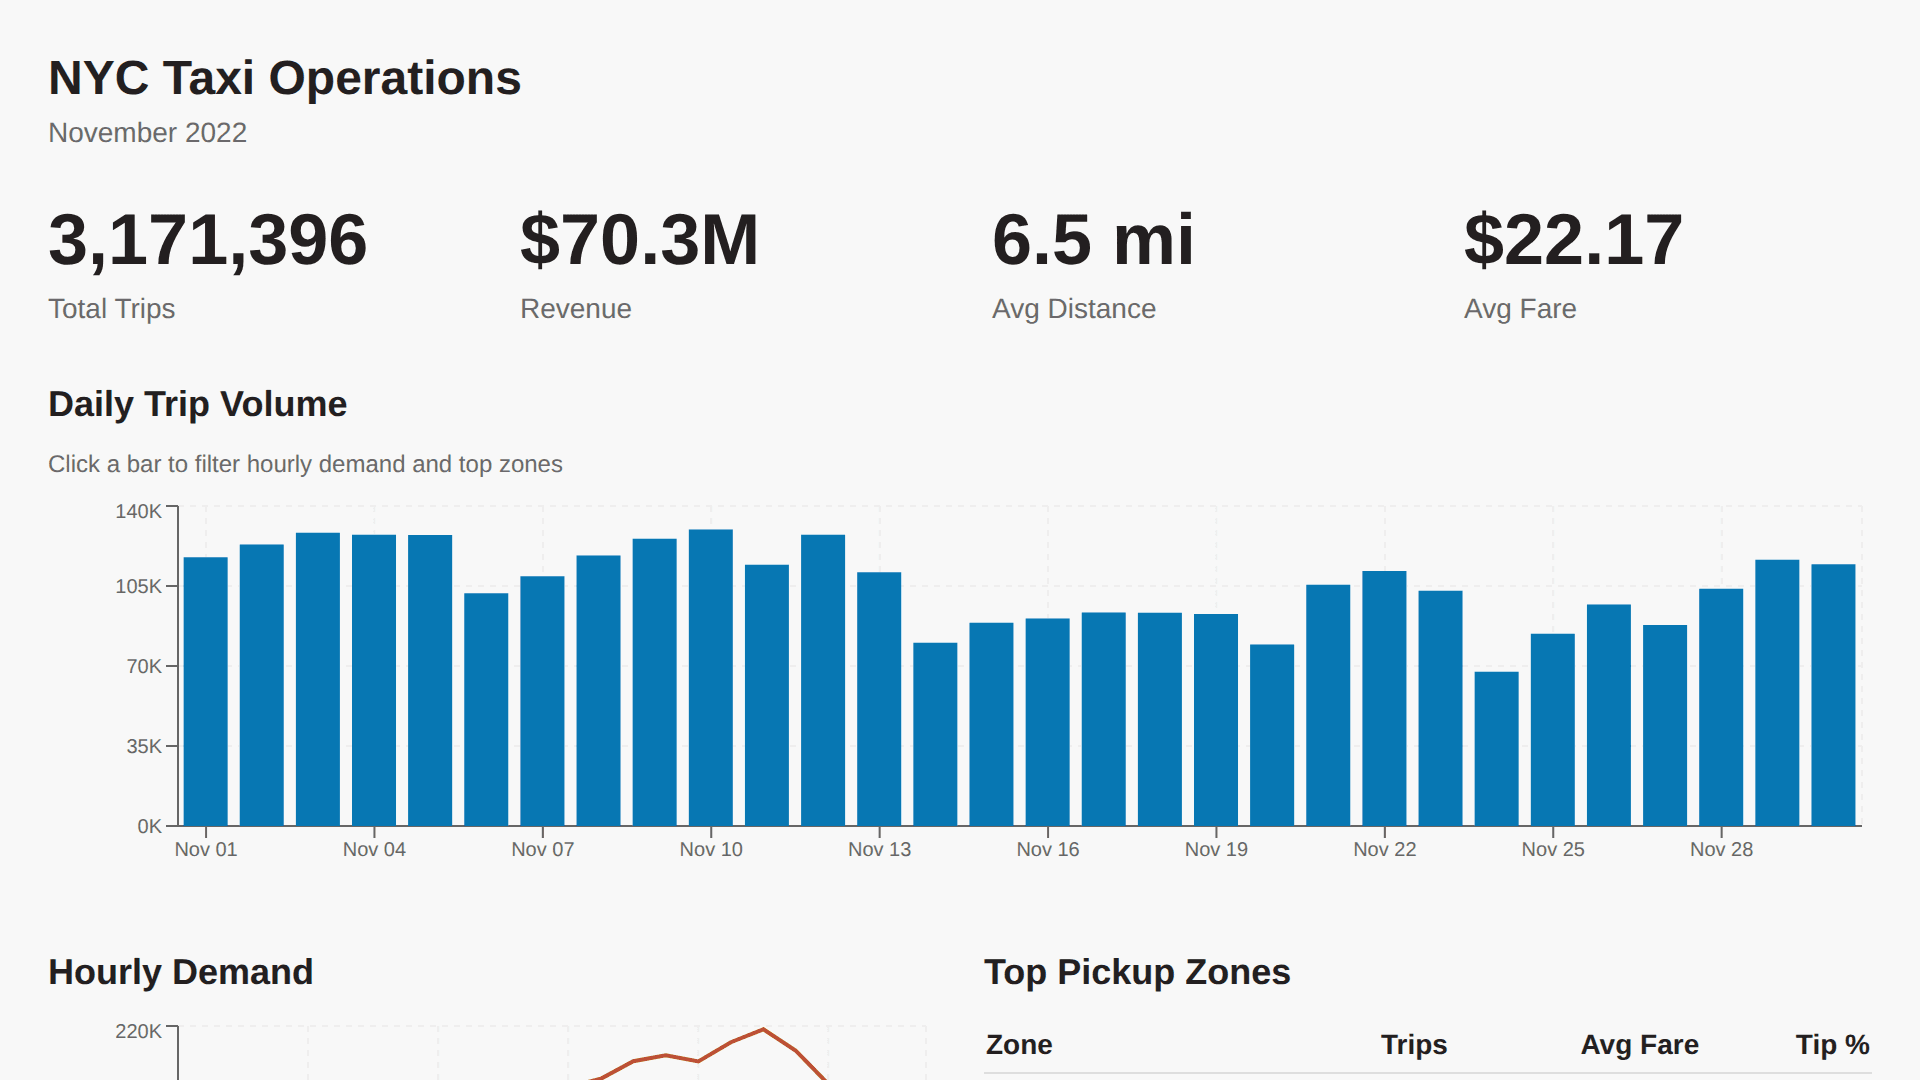
NYC Taxi Operations Dashboard
Daily operations dashboard for NYC taxi fleet management — KPIs, daily trip volume, hourly demand patterns, and top pickup zones.
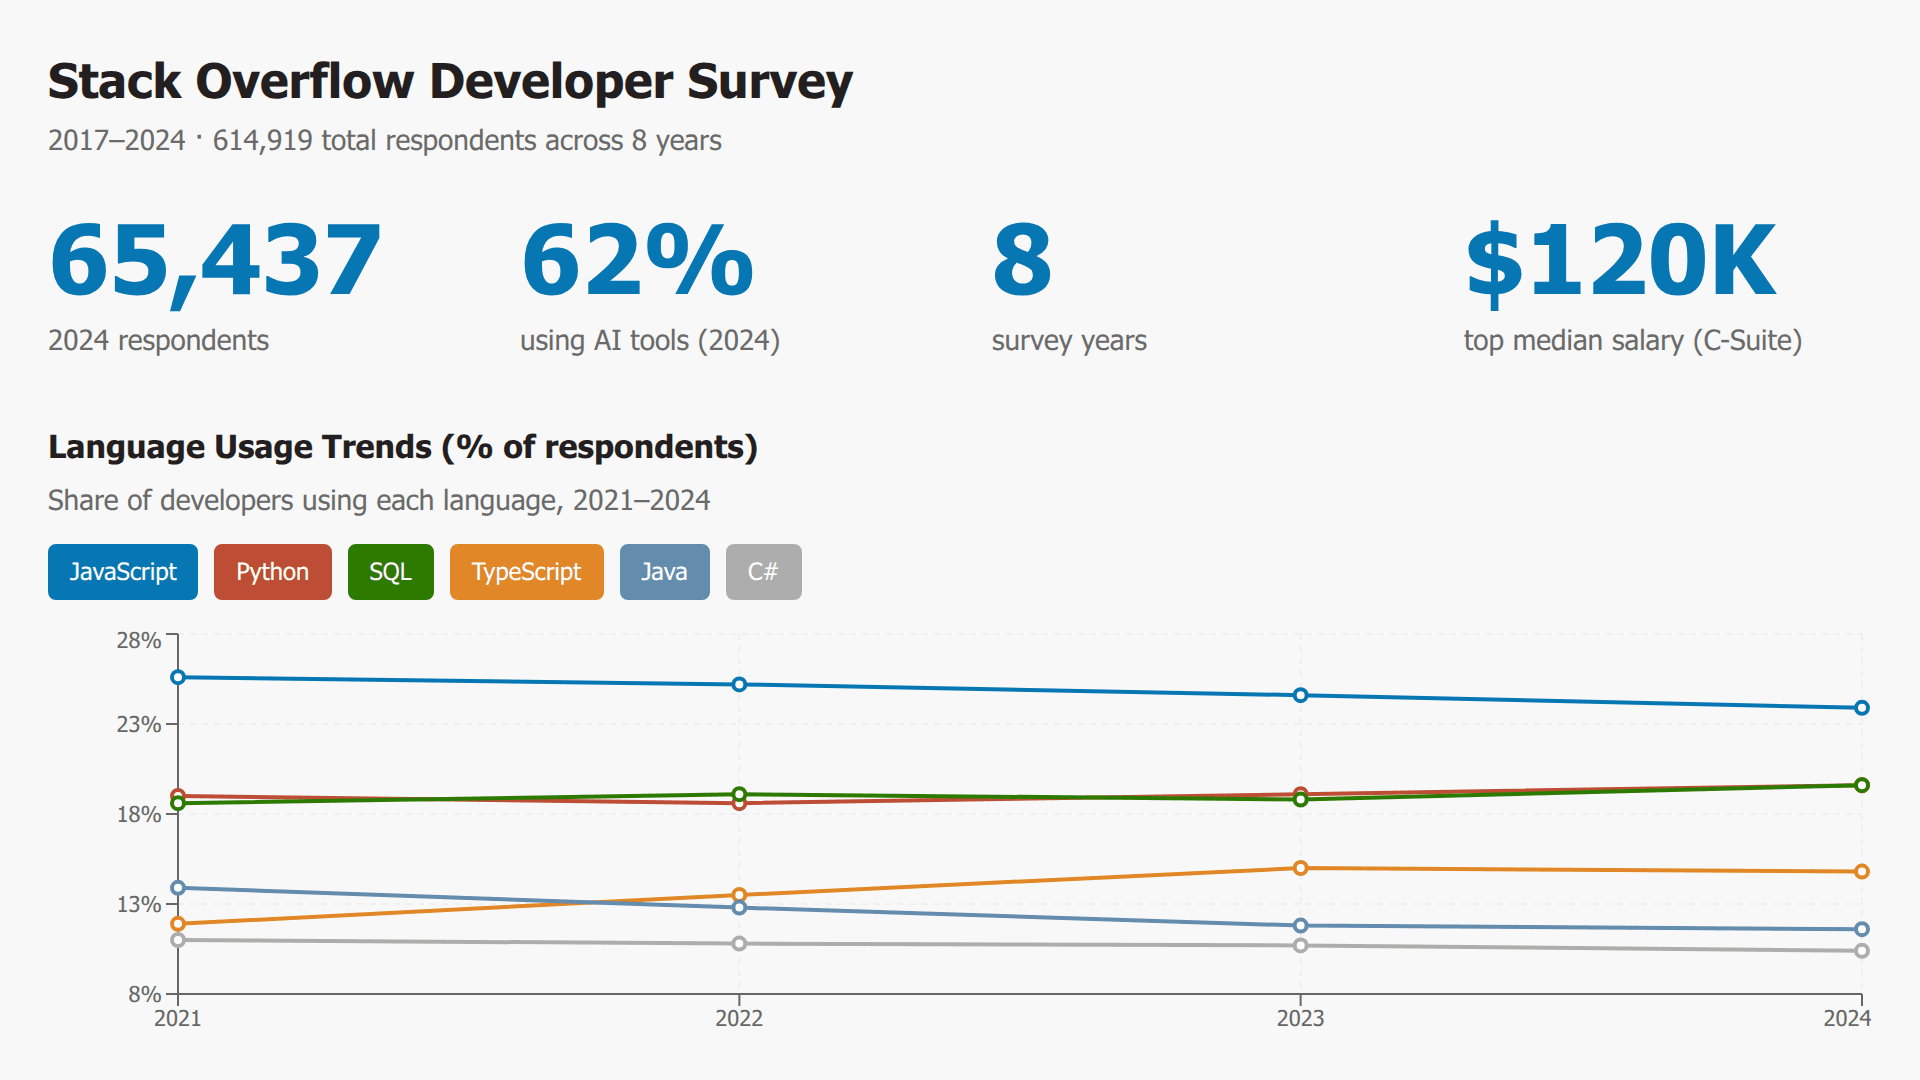
Stack Overflow Developer Survey
Interactive dashboard covering 2017–2024 Stack Overflow Developer Survey data. Shows language usage trends (2021–2024) with toggleable filters, AI tool adoption rates (2024), and median salary by developer role (2024).
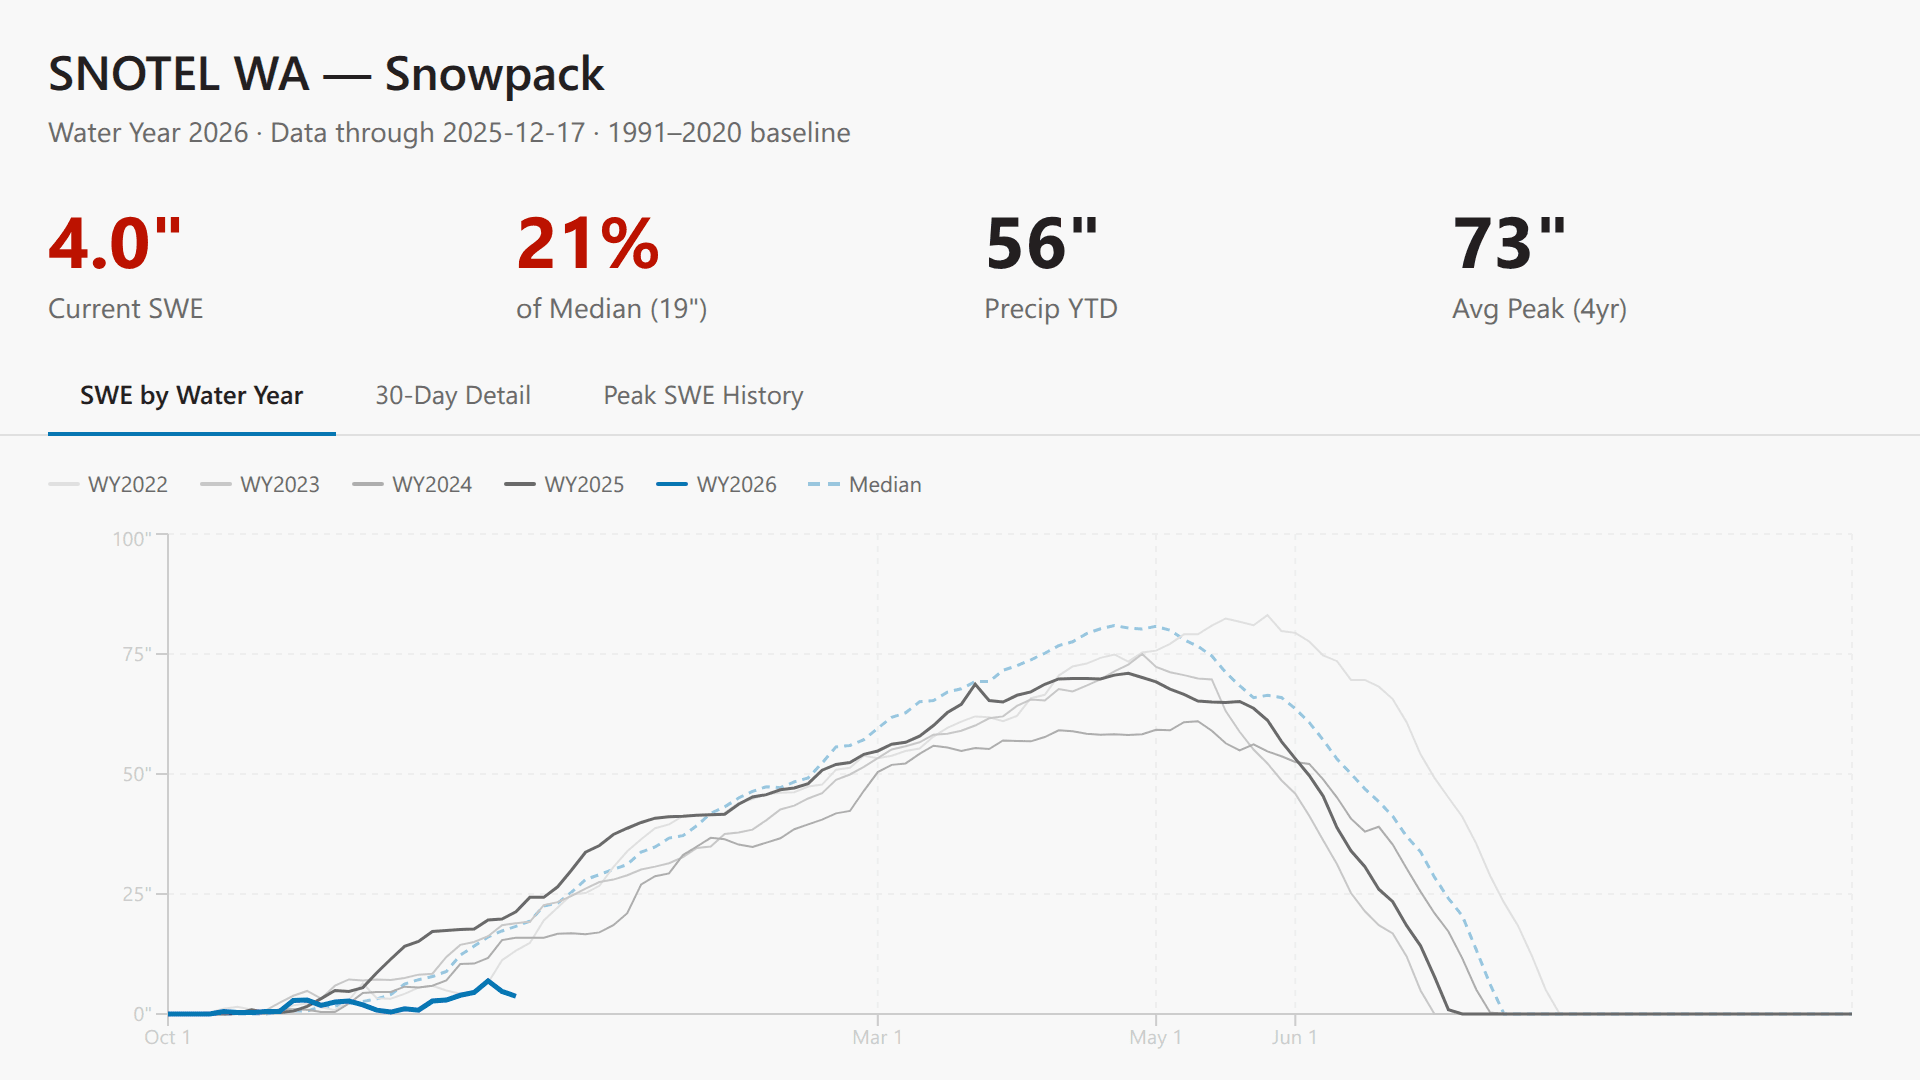
SNOTEL WA Snowpack WY2026
Washington state SNOTEL snowpack monitoring with multi-year SWE comparison (WY2022–2026), 30-year median baseline, 30-day detail view, and peak SWE history. Live queries against snotel_wa database.
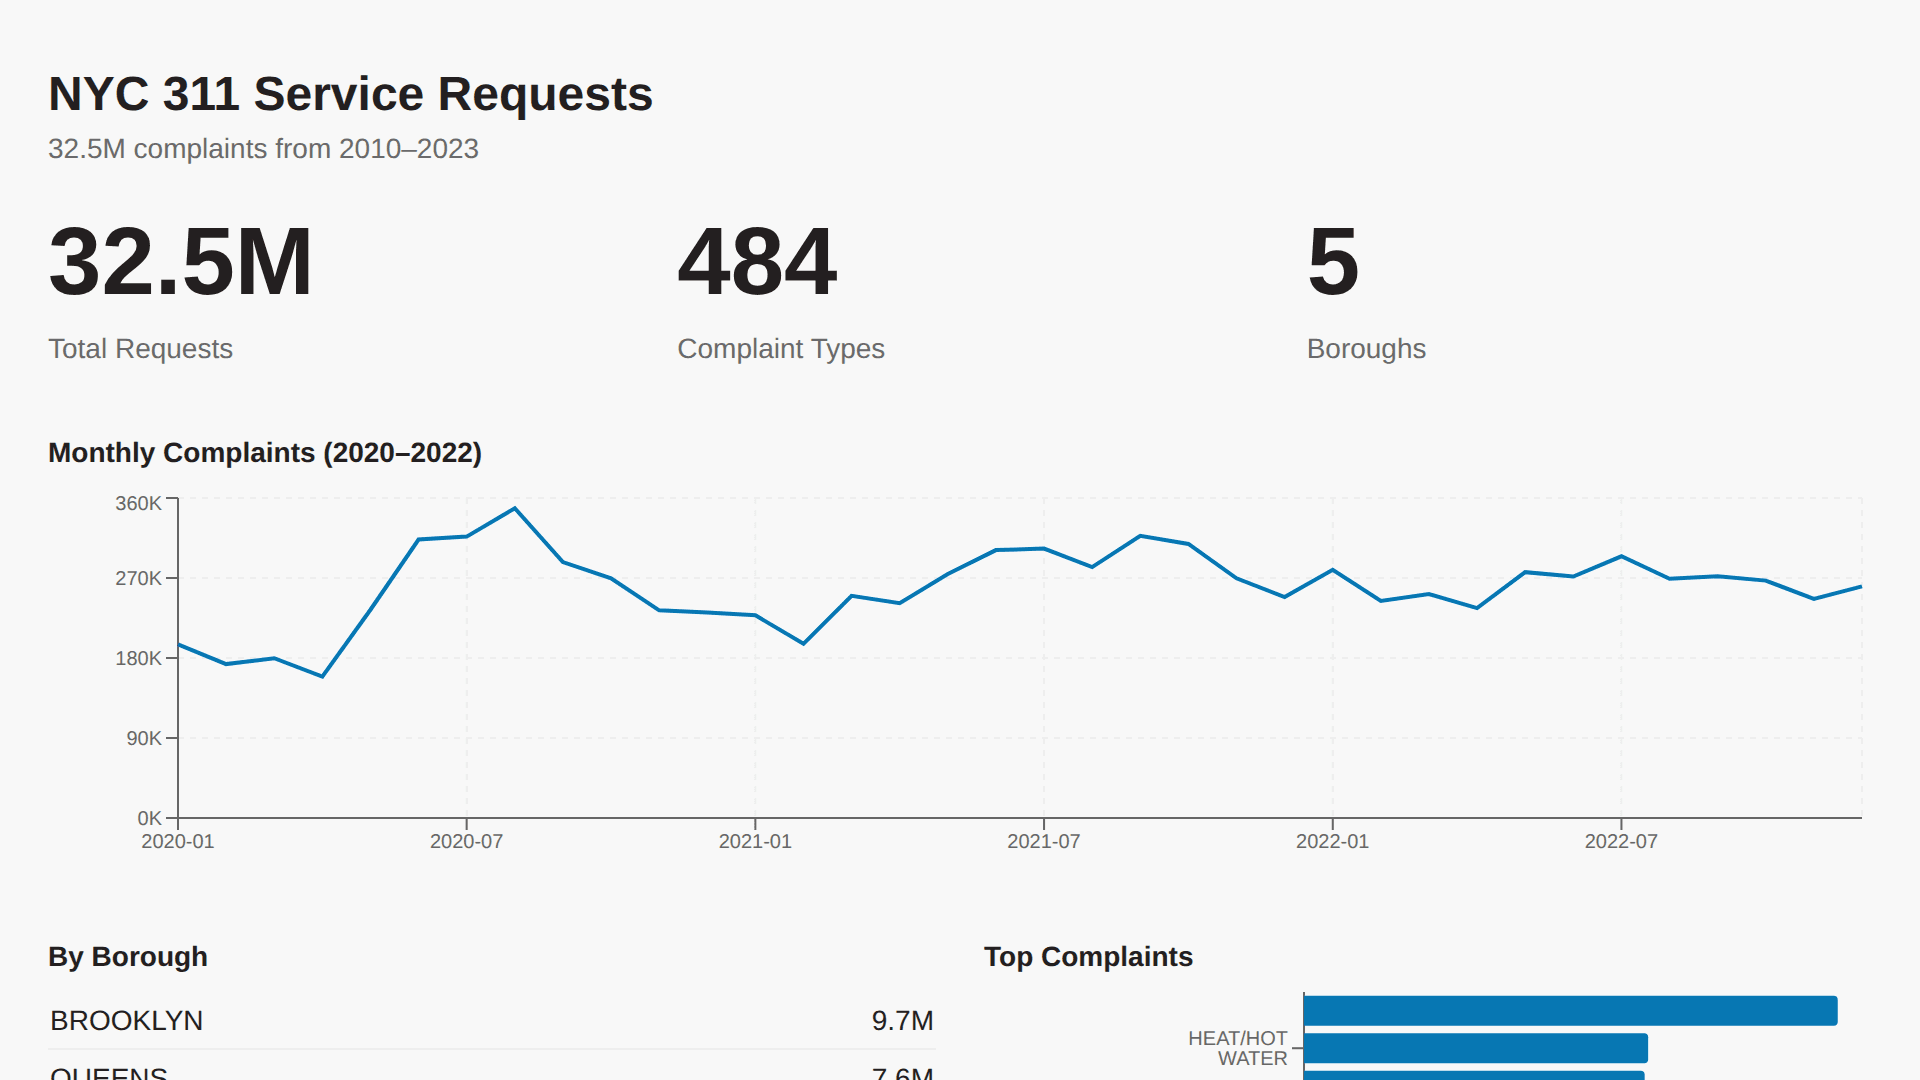
NYC 311 Service Requests
Dashboard of 32.5M NYC 311 complaints (2010–2023) showing monthly trends, borough breakdown, and top complaint types.
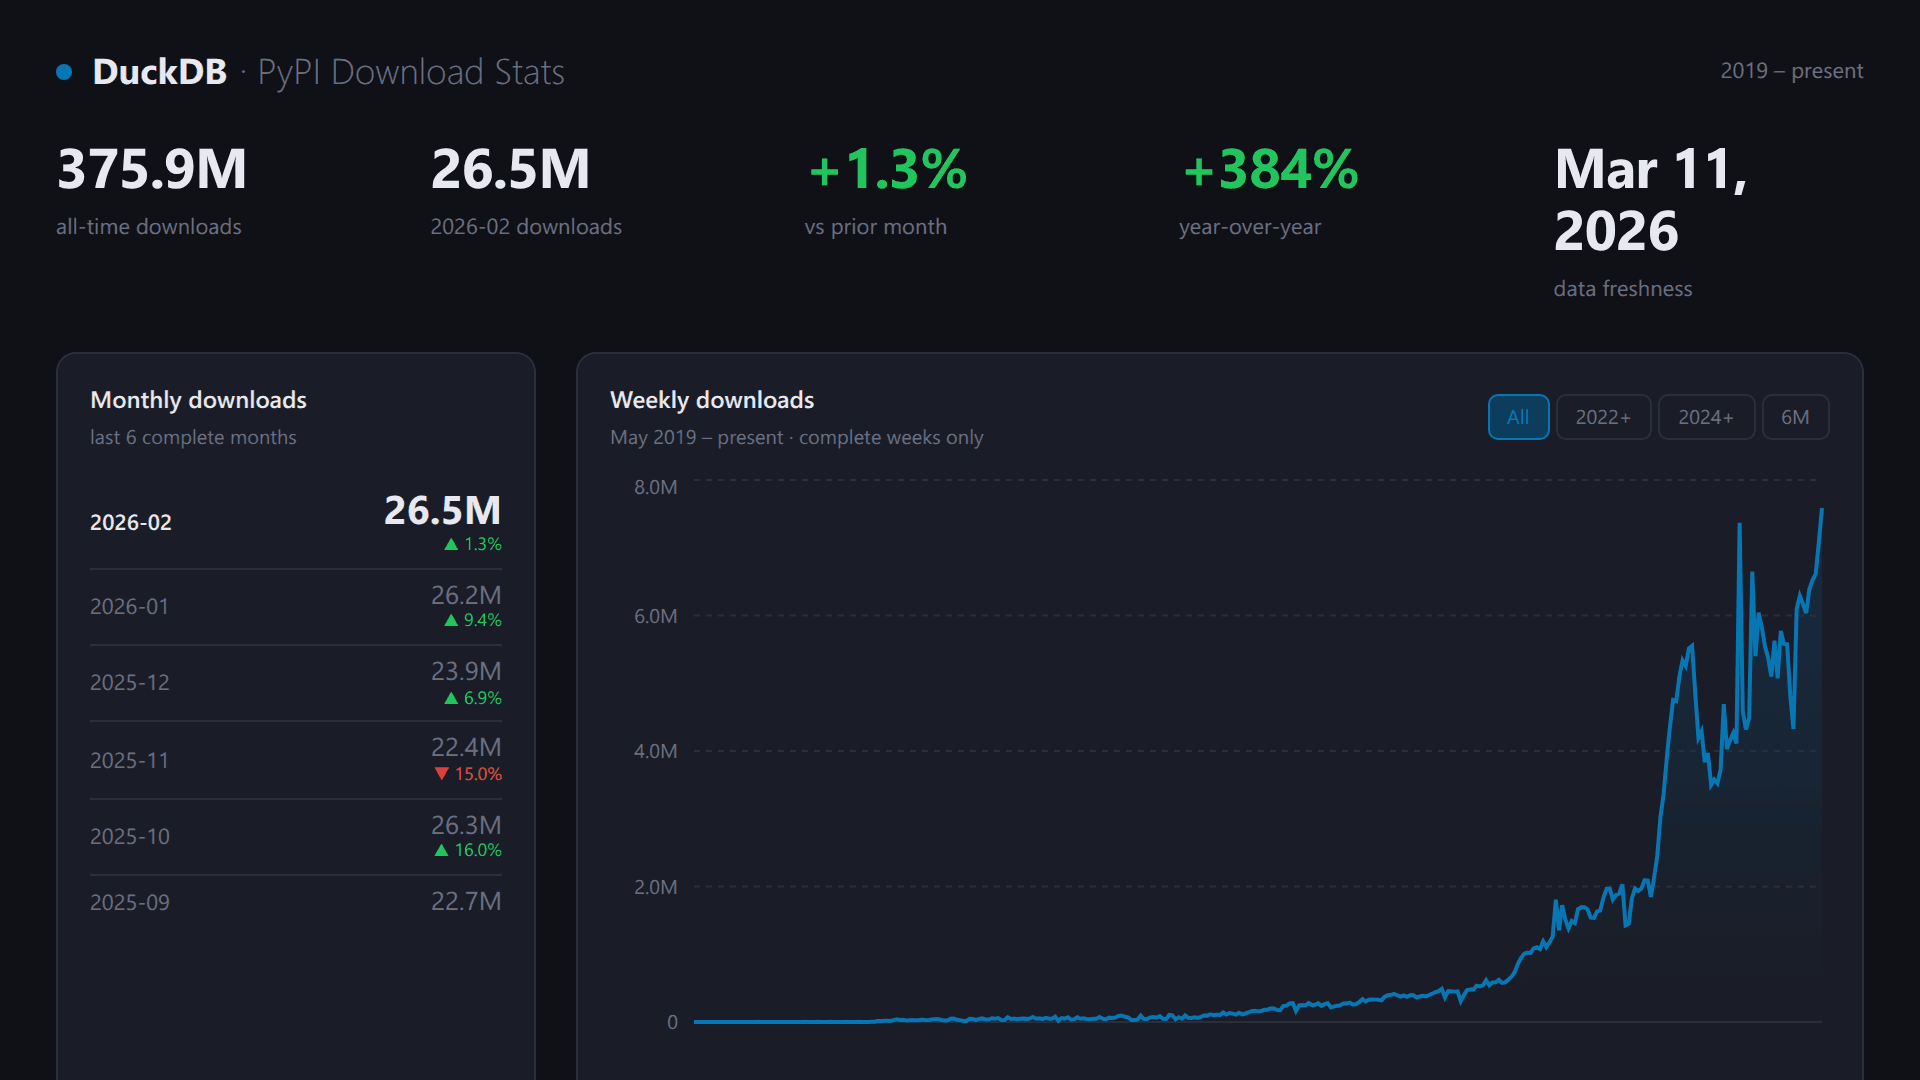
DuckDB PyPI Download Stats
Weekly and monthly DuckDB download trends on PyPI since 2019, with version, Python, country and OS breakdowns. Sourced from public MotherDuck share `duckdb_stats` | ATTACH 'md:_share/duckdb_stats/1eb684bf-faff-4860-8e7d-92af4ff9a410' AS duckdb_stats;
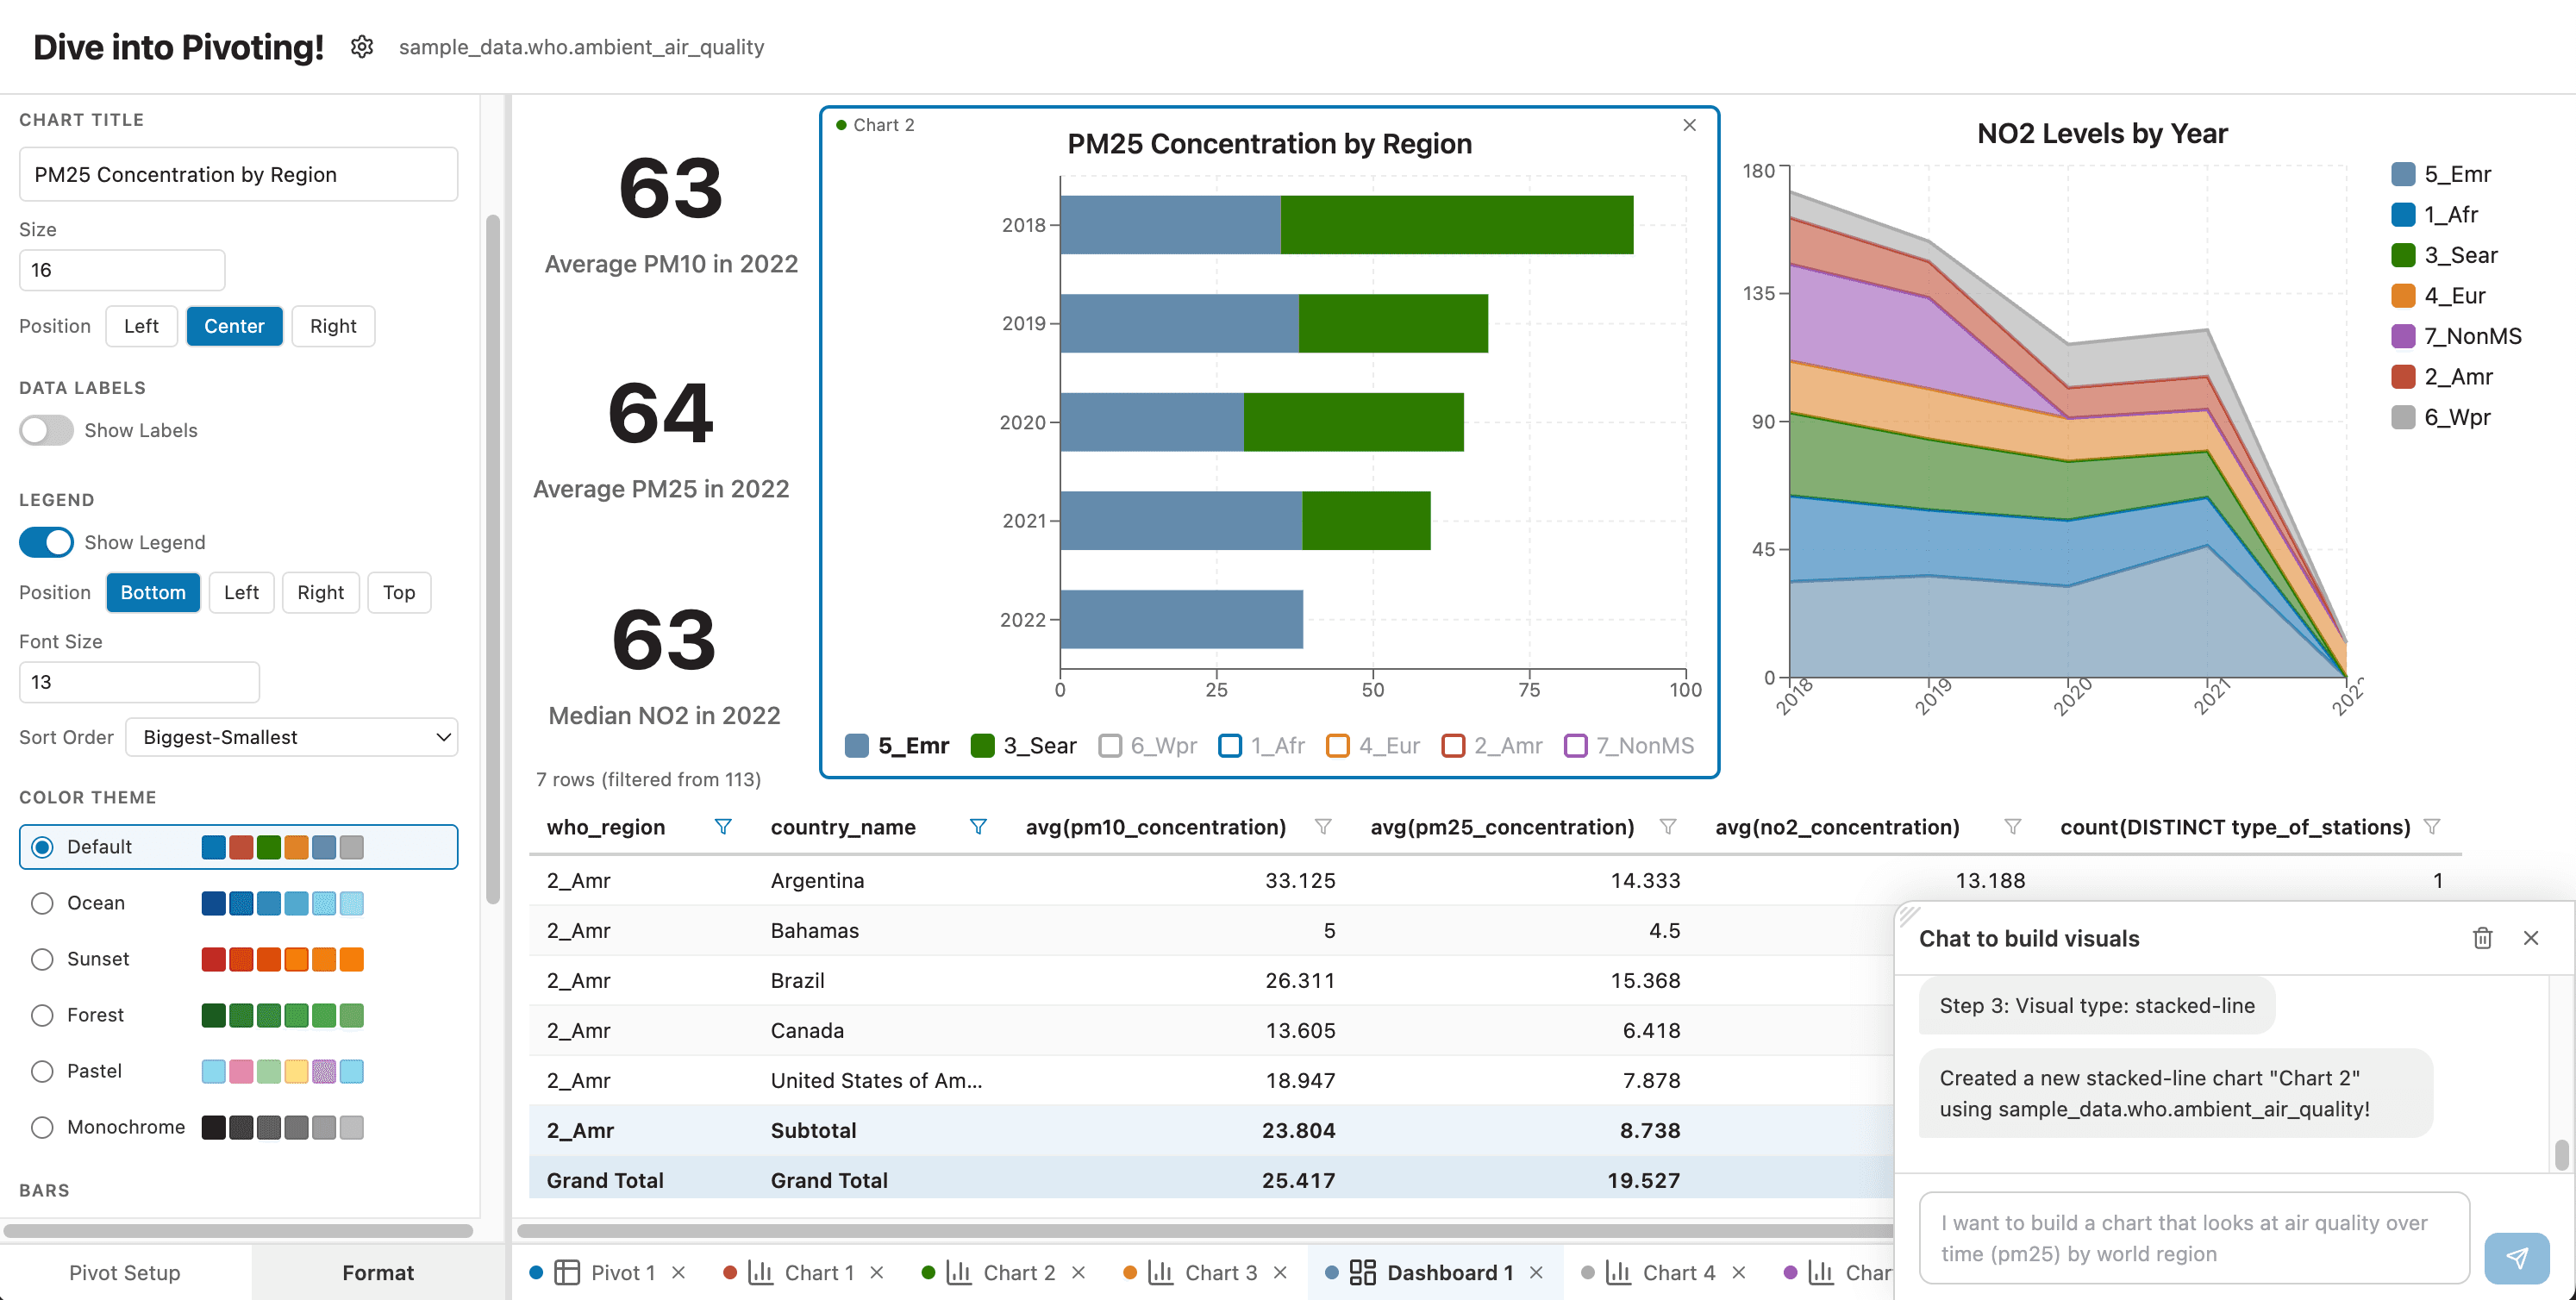
Dive into Pivoting!
Interactive pivot table, pivot chart, and dashboard experience on any dataset! Browse databases/schemas/tables, drag columns into Filters, Columns, Rows, and Values quadrants to dynamically build pivot queries. Assemble into a dashboard with drag and drop. Even use MotherDuck's PROMPT function to have an AI agent build your pivot for you with natural language!